
How to Use Cross-Channel Data for Marketing Insights: A Practical Guide
In 2025, people will see or use a store or brand in about 8 to 10 different places before they buy something.
They might see it on TikTok or Instagram, get an email, walk into the real store, or call on the phone.
That’s a lot of places!
But most companies look at each place all by itself. They don’t connect the dots.
The smart companies, the winners, put all those places together like puzzle pieces. They turn a big, messy pile of clues into one clear, easy picture of what the customer really wants.
When you connect the dots across channels, you stop guessing. You start predicting. You move from “we think customers want this” to “we know exactly what they will do next, and here’s the proof.”
This guide shows marketing professionals, data analysts, and CMOs exactly how to do it, step by step, with tools you can start using tomorrow.
What Cross-Channel Data Really Means in 2025
Cross-channel data (also called omnichannel data) is every piece of information a customer leaves behind, no matter where they interact with your brand.
Examples:
- Website clicks and time spent
- Mobile app behavior
- Email opens and link clicks
- In-store purchases and loyalty card scans
- Social media likes, comments, and direct messages
- Call-center notes and chat transcripts
- Smart-speaker voice searches
- Reviews and survey answers
When you combine all of these, you get customer journey analytics that actually reflect real life.
Stat: Companies that excel at omnichannel engagement metrics retain 89% of their customers, compared to just 33% for companies with weak omnichannel strategies (McKinsey, 2024).

The 6 Biggest Benefits You Get When You Master How to Use Cross-Channel Data for Marketing Insights
- AI-powered personalization that feels human, not creepy
- Higher ROI because you spend money only on the channels and messages that work
- Faster product launches thanks to real-time marketing insights
- Stronger customer loyalty through seamless customer experience optimization
- Accurate predictive customer modeling (know who will churn before they do)
- Clear proof of marketing ROI measurement that even the CFO loves
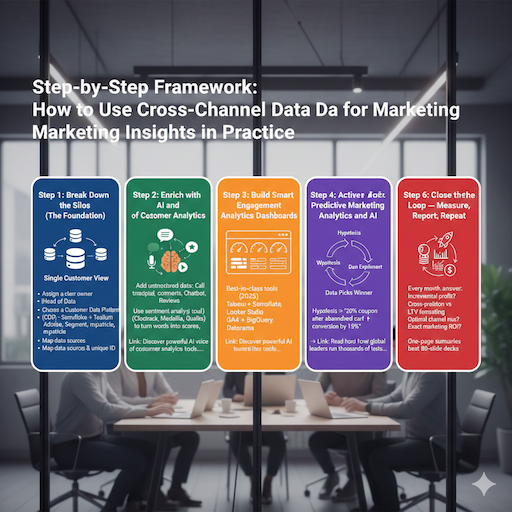
Step-by-Step Framework: How to Use Cross-Channel Data for Marketing Insights in Practice
Step 1: Break Down the Silos (The Foundation)
Most companies still have separate teams and databases for email, paid ads, the website, and the physical store. Your first job is to create a single customer view.
Action checklist:
- Assign a clear owner (usually Head of Data or Customer Intelligence)
- Choose a Customer Data Platform (CDP) — popular options in Tier 1 & 2 markets: Snowflake + Tealium, Adobe Experience Platform, Segment (Twilio), or mParticle
- Map every data source and give each customer one unique ID
Step 2: Enrich with AI and Voice of Customer Analytics
Raw clicks are useful. Emotions are gold.
Add unstructured data:
- Call-center transcripts
- Social media comments
- Chatbot conversations
- Product reviews
Use sentiment analysis tools (Clootrack, Medallia, Qualtrics XM) to turn words into scores. Suddenly, you know not only what customers did, but how they felt.
Link: Discover powerful AI voice of customer analytics tools that turn feedback into instant actions.
Step 3: Build Smart Engagement Analytics Dashboards
Stop staring at 47 different reports.
Create one dashboard that answers three questions every Monday morning:
- Where are we winning this week?
- Where are we losing?
- What test should we run next?
Best-in-class tools used by Fortune 500 brands in 2025:
- Tableau + Snowflake
- Looker Studio (free tier still strong)
- Google Analytics 4 + BigQuery + Data Studio
- Datorama (Salesforce Marketing Cloud Intelligence)
Step 4: Adopt a “Test and Learn” Culture Backed by Real Data
Mastercard’s famous test and learn marketing framework is now used by retailers and banks worldwide because it removes emotion from the decision.
How it works in three lines:
- Hypothesis → “Sending a 20% coupon on mobile after an abandoned web cart increases conversion by 15%.”
- Run a controlled experiment across channels using cross-channel data.
- Let the data pick the winner automatically.
→ Link: Read how global leaders run thousands of tests every year with the test and learn framework.
Step 5: Activate Predictive Marketing Analytics and AI
2025 is the year predictive customer modeling moved from “nice to have” to table stakes.
Simple models you can launch this quarter:
- Next-best-action models (what to offer this customer right now)
- Churn prediction
- Lifetime value forecasting
- Optimal channel mix per segment
Tools that don’t require a PhD:
- Google Cloud Vertex AI AutoML
- Adobe Sensei
- Salesforce Einstein
- H2O.ai Driverless AI
Step 6: Close the Loop — Measure, Report, Repeat
Every month, answer:
- Which campaigns drove incremental profit? (Use incrementality testing)
- How much revenue came from cross-channel customers vs single-channel?
- What was the exact marketing ROI measurement?
Use marketing data visualization that executives actually understand — one-page summaries beat 80-slide decks.
Real-Life Success Stories (2024–2025)
A big clothing store in Europe and North America did something smart.
The store watched what people looked at on the internet. They knew when those same people walked into the real shop. They saw which emails people clicked on.
They put all those clues together. They made special lists of people who were super ready to buy something right now. Explore the platform1
When one of those people got really close to the store (it’s about as far as walking across five soccer fields), the store sent a fun coupon right to their phone!
Result: 41% more people bought something that same day. That means almost half more sales!
A big bank in America listened to phone calls and watched how people used the bank’s app.
They found out that customers who said “I’m confused about fees” were 7 times more likely to close their accounts soon.
So the bank made a friendly robot chat that explains fees using easy, everyday words.
After six months, 18% fewer customers left the bank. Lots of people stayed happy!
A huge online shopping company in Asia ran 12,000 little tests in 2024.
They learned that in Indonesia and India, sending a quick WhatsApp message when someone leaves items in their cart works 3 times better than sending an email. See how it works2
So they took 30% of their email money and spent it on WhatsApp messages instead.
That simple change made them an extra $180 million!
Best Tools in 2025 for Analyzing Customer Behavior Across Channels
| Category | Top Tools (2025) | Best For |
| Customer Data Platform | Snowflake + Tealium, Adobe AEP | Enterprise scale |
| Voice of Customer + Sentiment | Clootrack, Medallia, Qualtrics | Real-time emotion tracking |
| Testing & Personalization | Optimizely, Dynamic Yield, Adobe Target | Fast experiments |
| Predictive & AI | Google Vertex AI, Salesforce Einstein | No-code machine learning |
| Dashboard & Visualization | Tableau, Looker, Power BI | Executive reporting |
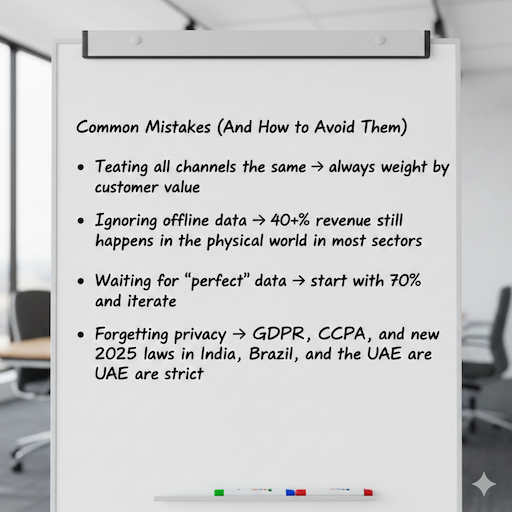
Common Mistakes (And How to Avoid Them)
- Treating all channels the same → always weight by customer value
- Ignoring offline data → 40%+ of revenue still happens in the physical world in most sectors
- Waiting for “perfect” data → start with 70% and iterate
- Forgetting privacy → GDPR, CCPA, and new 2025 laws in India, Brazil, and the UAE are strict
Quick-Start Checklist: Launch Your Cross-Channel Program This Quarter
- Appoint a cross-channel data owner
- Connect at least 3 core data sources this month
- Pick one CDP or data warehouse and start loading data
- Build your first unified dashboard
- Run one simple test using the test and learn marketing framework
- Add one source of voice-of-customer feedback
- Present the first cross-channel insight to leadership
FAQs
What is cross-channel data?
It’s all the little clues a customer leaves everywhere they touch your store — on the website, in the real shop, on Instagram, in emails, on the phone, everywhere! We put all those clues together like one big story3.
Why do customers use so many places before they buy?
In 2025, kids and grown-ups will see fun ads on TikTok, get emails, walk past the store, and talk on the phone. They touch the brand 8 to 10 times before they say, “Yes, I want it!”
Do most companies do this right?
Nope! Most companies look at each place all alone. They don’t connect the dots. The smart companies connect everything and win big.
What happens when you connect all the channels?
You stop guessing what customers want. You KNOW what they will do next. It’s like having magic glasses that show the future!
What is a Customer Data Platform (CDP)?
It’s like a giant toy box that holds every clue about every customer in one place, so nothing gets lost.
Why should we listen to how customers feel?
Because clicks only tell you what they did. Their words tell you if they were happy, mad, or confused. Feelings are the real gold!
What is the easiest way to start?
Pick one boss for the project. Connect just 3 places (like website + email + shop). Make one simple picture (dashboard) that shows what’s working. Run one tiny test. That’s it — you’re already winning!
Conclusion
In 2025, you must learn to use data from all places to sell ideas. It is not a choice now. It helps you lead your work or just try to follow.
The best companies win by seeing each talk with a buyer as part of one long chat. Link the data. Hear the feelings. Try things fast. Let smart machines do the hard jobs. This makes for fun times that feel special just for you. And it brings big wins you can’t miss.
References
- Merkle (2025) – Drive Human Connection with AI-Powered Intelligence → Excellent framework on blending AI with human-centric marketing Read the full article ↩︎
- Mastercard Data & Services – Test & Learn® Platform → The gold standard in controlled experimentation at scale See how it works ↩︎
- Clootrack – AI Voice of Customer Analytics Tools → Real-world examples of turning unstructured feedback into revenue Explore the platform ↩︎